

Construction Spending Up Yearly & Is Vegas Inventory Peaking? | Jordan Dove's Market Pulse
For the week of September 5, 2022

For the week of September 5, 2022

IS CLARK COUNTY INVENTORY PEAKING?
NATIONAL CONSTRUCTION SPENDING UP YEARLY
“For every minute you are angry you lose sixty seconds of happiness.”—Ralph Waldo Emerson, American essayist, lecturer, philosopher, and poet

In July, total residential construction spending fell 1.5% below June’s revised estimate, to a $920.4 million annual rate. However, that number is still 14.1% above where residential spending was in July a year ago.

June saw the smallest monthly home price gains in two years. Both the Case-Shiller index, up 0.3%, and the FHFA index for homes financed with conforming mortgages, up just 0.1%, came in with sharp decelerations.
And July saw price gains reverse in Black Knight’s home price index. They reported the median U.S. home price slid 0.77%--the first monthly drop in nearly three years and the largest one-month decline in more than 11 years.
New listings - a measure of sellers putting homes up for sale - were again down 12% from one year ago. This week marks the eighth straight week of year over year declines in the number of new listings coming up for sale and a third consecutive week of double digit declines.
Economic Notes
The Fed is expected to raise rates 50-75 basis points at the upcoming FOMC meeting later this month.
The United States S&P Global Composite PMI (Aug) came in below the forecast of 45 to 44.6 (Previous month was 47.7)
The United States ISM Non-Manufacturing PMI (Aug) came in above the forecast (56.9) and higher than the previous month (56.7) at 56.9. A reading above 50 percent indicated the non-manufacturing sector economy is generally expanding; below 50 percent indicates the non-manufacturing sector is generally contracting.
Payrolls rose 315,000 in August but the August jobs report shows declining labor force participation among Black workers.
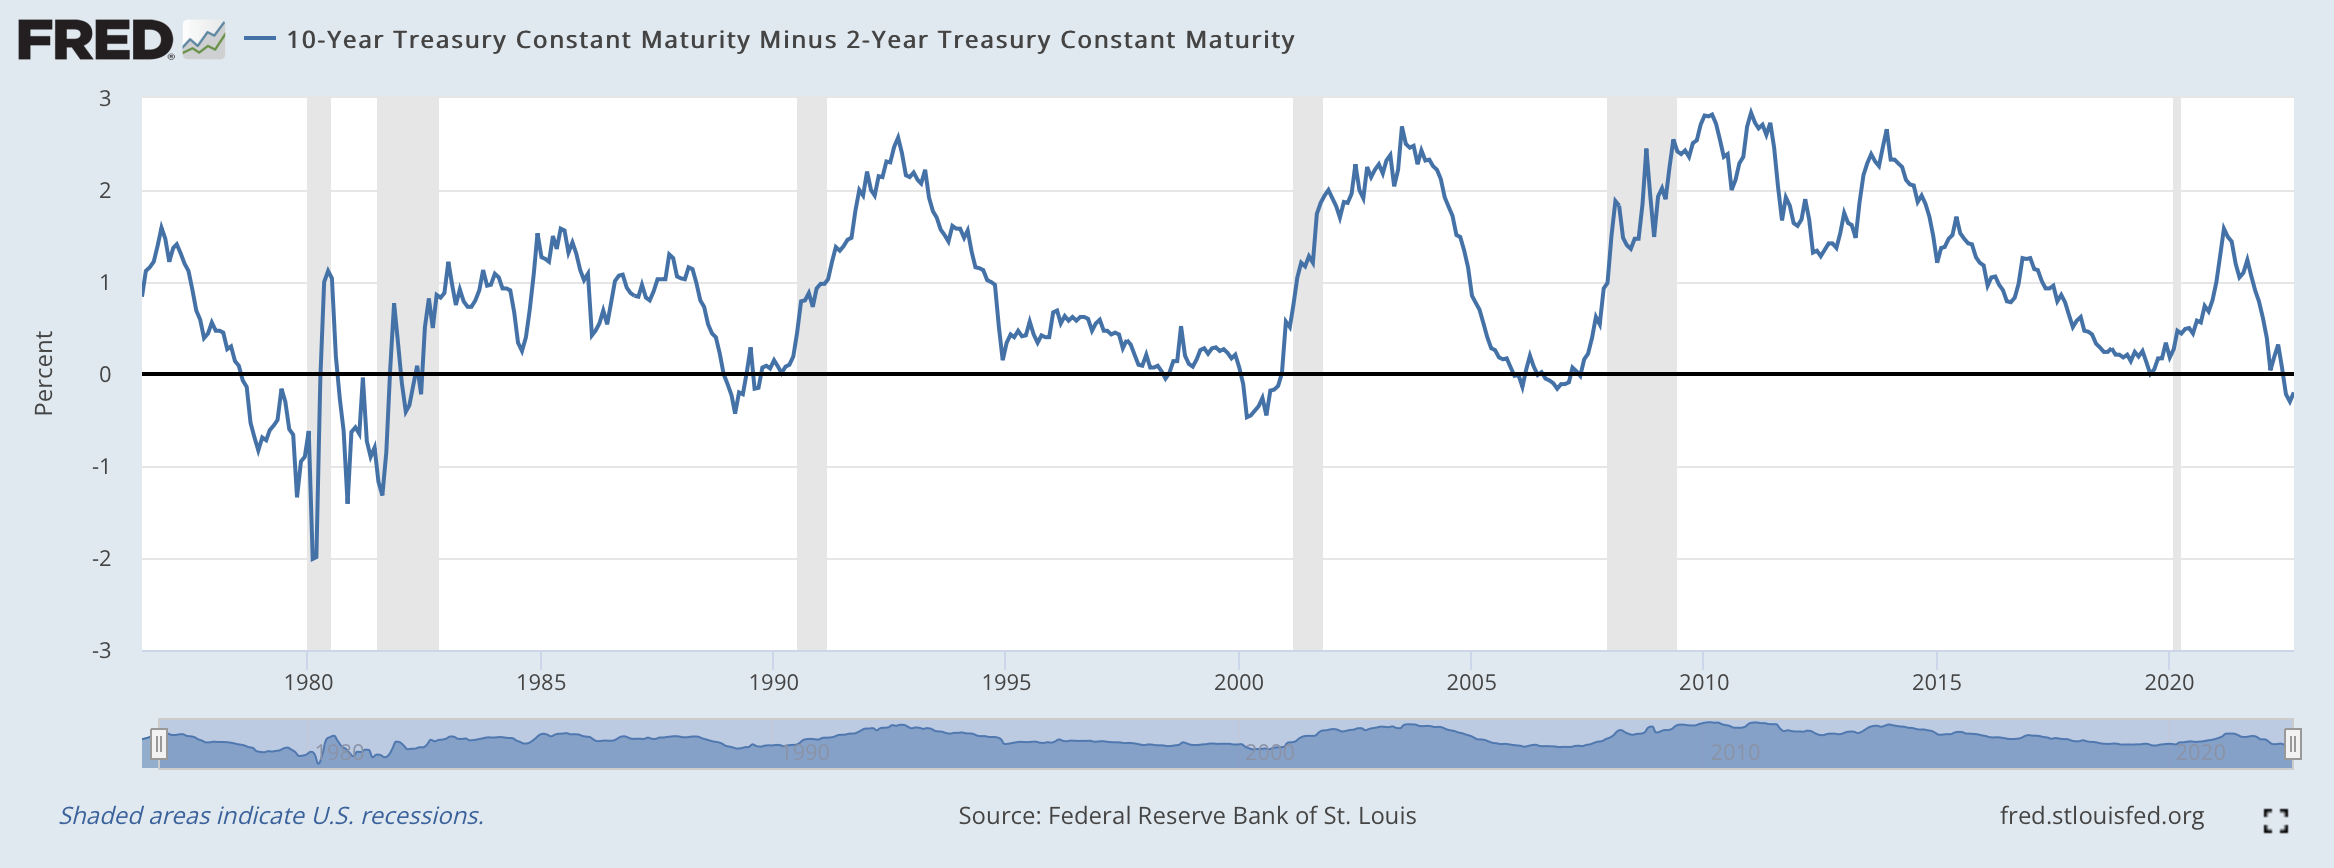
Inverted Yield Curve Watch
30 Year Treasury Yield: 3.478%
10 Year Treasury Yield: 3.328%
5 Year Treasury Yield: 3.428%
2 Year Treasury Yield: 3.491%

There are some interesting statistics this week as we evaluate the state of the market for Clark County, NV. For the first time in ten weeks, the absorption rate figure has increased, up .79% from last week's reading.
Inventory grew by only 18 properties from last week’s reading. This is the lowest number since we started charting this data on a weekly basis in March, 2022. This may signal that inventory is starting to peak as we head into a fall season.
Price reductions remain consistent with 1,813 this week, which means 16.30% of Sellers reduced their asking price for SFR, TWH, CON, MAN, MULTI & HIRI.
With the same residential properties we track, August saw a total of 5 months of inventory. 6 Months of inventory is considering an even buyers & sellers market.
Property still sold relatively quickly for a median of 17 days to sell for August 2022. The small sample size for September, 2022 is currently showing a median days on market of 22. For context, in April of this year it took 7 days to sell. In 2011, homes sat an average of 97 days on the market.
Investors are still strong in the market, with 24% of all properties trading hands in August in all-cash. Multi-family demand remains strong as rents are still commanding high premiums. Are you ready to start investing in real estate or want to discuss options of “house hacking” or obtaining multi families?
Schedule an appointment with me to discuss your real estate goals. It’s complimentary.
—
Clark County, NV Absorption Rate
21.79%
The current absorption rate for the Southern Nevada market the past four weeks is 21.79%, up 0.79% from last week's absorption rate. This marks the first increase in the absorption rate after ten consecutive weeks of a decline.
A market with an absorption rate at or above 20% is typically called a seller’s market, whereas an absorption rate below 15% signals a buyer’s market.
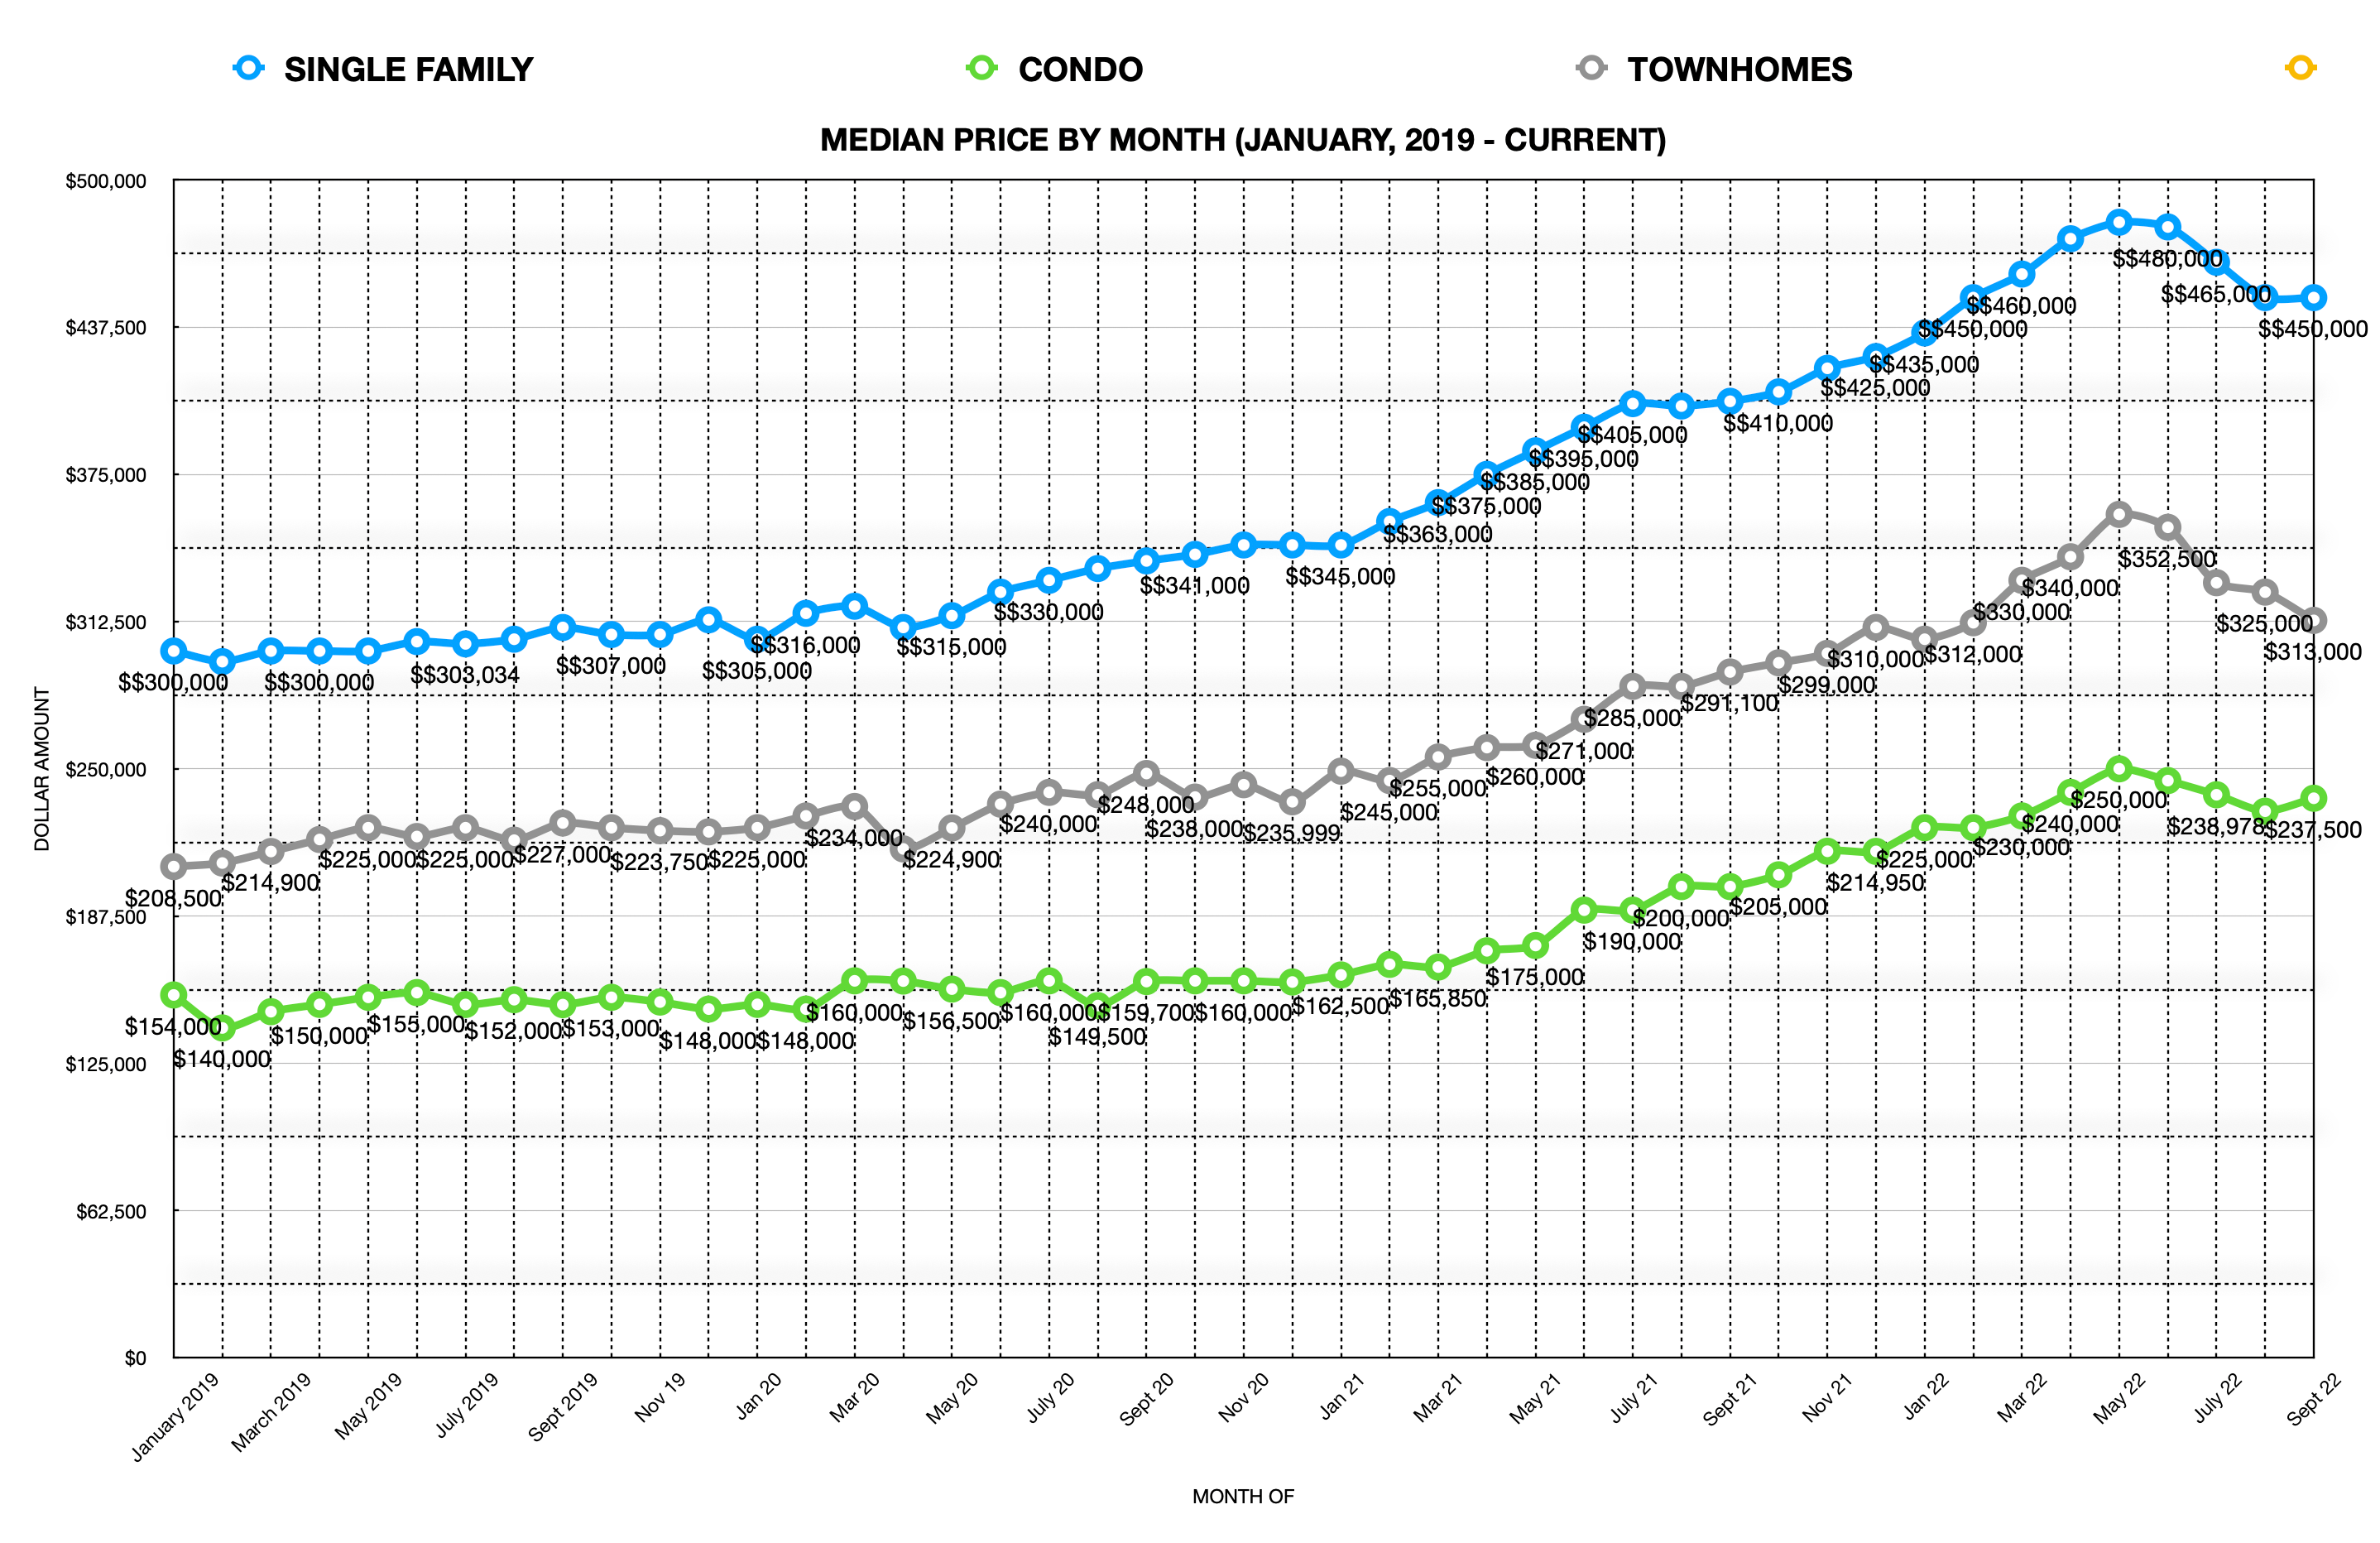
Each week we will update the current median price for the current month. Keep in mind the majority of sales occur at the end of the month, so official numbers will be published on the first Monday of each month.
Current September Median Prices
Single Family
$450,000
(Unchanged from August of $465,000)
Condo
$237,500
(Up from August of $232,000 - Sept. sample of 27 condos)
Townhouse
$324,500
(Down from August of $325,000 - Sept. sample of 21 TWH)
The past 25 weeks have seen an increase of residential resale inventory available on the open market in Southern Nevada. This week however shows an increase of only 18 more residential resale properties on the market compared to one week ago, a signs that inventory may be peaking. Chart below shows total available inventory to total weekly closed sales. (Last updated September 5, 2022)

As of September 5, 2022, there are currently active (%’s versus 4 weeks ago):
8,387 Single Family Homes +3.74%
1,129 Condos +7.32%
773 Townhouses +7.06%
306 Manufactured Homes +10.47%
436 High Rise Units -0.46%
89 Multiple Dwellings -21.93%
2,563 Parcels of Land +4.02%
3,058 Rentals On Market +11.00%
Past Seven Days Market Watch (%’s versus 4 weeks ago):
1,120 New Listings -15.60%
213 Back On Market -11.25%
69 Price Increases -28.87%
1,813 Price Decreases -2.95%
786 Accepted an Offer -2..00%
614 Sold +17.85%
231 Expired +14.36%
530 Taken Off Market +13.49%
89* properties are coming soon +27.14%
This week, there are 18 more active residential resale properties on the market compared to one week ago for a total of 11,120, an increase of 0.16%.
*Properties coming soon do not indicate all of the upcoming properties. These are listing that are entered into the MLS prior to list date.

FED FEARS FRUSTRATE GOLDILOCKS JOBS... A not-too-hot, not-too-cold August jobs report wasn't enough to quell investor fears of another big Fed rate hike this month, so stocks dropped for the third week in a row.
Traders at first felt the Fed would ease up, given the mediocre 315,000 new jobs and unemployment climbing to 3.7%. But labor force participation rose to 62.4% and hourly earnings gained 0.3%, both signs of economic strength.
There were worries Russian giant Gazprom would prolong the halt of its natural gas flow to Europe, while over here, orders for manufactured goods fell in July. But ISM Manufacturing still showed expansion in August.
The week ended with the Dow down 3.0%, to 31,319; the S&P 500 down 3.3%, to 3.924; and the Nasdaq down 4.2%, to 11,631.
Bond prices overall also headed south, pushing yields and interest rates up, the 30-year UMBS 5.0% down 0.78, to $100.32. The national average 30-year fixed mortgage rate continued to move up in Freddie Mac's Primary Mortgage Market Survey. Remember, mortgage rates can be extremely volatile, so check with your mortgage professional for up-to-the-minute information.
DID YOU KNOW… Realtor.com reports seller sentiment is declining, as the number of newly listed homes keeps falling, down 12% from a year ago, even though home prices are still near record highs and home equity has shot up.

SERVICES GROWTH DOWN, JOBLESS CLAIMS UP... The big services sector of the economy is expected to keep growing in July, but at a lower rate by the ISM Non-Manufacturing Index. Weekly Initial Jobless Claims should head up a bit, also indicating a slowing economy, something the Fed wants, to stem inflation.
All U.S. financial markets were closed yesterday, September 5, in observance of Labor Day.

While buyer demand has moderated and housing supply has grown in recent months, it’s still a sellers’ market because inventory is low.
The latest data shows sellers continue to benefit from serious buyers and competitive offers. In July, the average home received 2.8 offers and 39% sold over the asking price.
You haven’t missed your opportunity to sell. Let’s connect to start the process today.

Forecasting Federal Reserve policy changes in coming months. The Fed Funds Futures market expects rate hikes for the rest of the year, starting with a three-quarter percent bump this month. Note: In the lower chart a 57.0% probability of change is a 57.0% probability the rate will rise. Current rate is 2.25%-2.50%
AFTER FOMC MEETING ON: CONSENSUS
Sep 21 3.00%-3.25%
Nov 2 3.25%-3.50%
Dec 14 3.50%-3.75%
Probability of change from current policy:
AFTER FOMC MEETING ON: CONSENSUS
Sep 21 57.0%
Nov 2 92.5%
Dec 14 90.4%