For the week of February 13, 2023
“The only place success comes before work is in the dictionary.”—Vince Lombardi, American football coach and executive
📈 MTG. LOAN LOCKS HIGHEST JUMP IN 5 YEARS
💸 TREASURY BONDS CONTINUE MOVING NORTH
🤯 CPI REVISED HIGHER FOR Q4. INFLATION NATION.
📉 MEDIAN VEGAS PRICES DOWN SO FAR IN FEB.
We hope you enjoy the content of this weekly market pulse newsletter. Our goal is to analyze and keep you informed on the economy and real estate market so you can make better, informed decisions. We’re here to help you with your real estate needs (residential, commercial & investments) when you’re ready.
Call/text us at (702) 721-7332 or e-mail Jordan@DoveandAssociates.com
TAKING A BREAK... Traders paused from their upbeat activities since the start of the year, as stocks fell for the week on disappointing Q4 corporate earnings and economic data, and hawkish comments from the Fed.
Chair Powell said the Fed has a significant road ahead to get inflation down to 2%; the Trade Balance revealed a global trade slowdown; and the Treasury Budget reported a $38 billion deficit, versus a $118 billion surplus a year ago.
But low initial jobless claims indicated the economy could still see a soft landing and the University of Michigan Consumer Sentiment Index rose to a 13-month high, showing Americans are cautiously optimistic.
The week ended with the Dow down 0.2%, to 33,869; the S&P 500 down 1.1%, to 4,090; and the Nasdaq down 2.4%, to 11,718.
Bonds overall fell sharply, the UMBS 5.5% dropping 1.01, to $100.11. Freddie Mac's Primary Mortgage Market Survey reported a slight increase in the national average 30-year fixed mortgage rate. Remember, mortgage rates can be extremely volatile, so check with your mortgage professional for up-to-the-minute information.
Black Knight reported purchase loan locks went up 64% from the first to last week of January, the largest jump in five years, as well as a growing trend of homebuyers paying points upfront to permanently reduce their mortgage rate.
While daily Optimal Blue rate lock data showed modest signs of an early-January rebound in purchase locks, refinance lending remains challenged despite a full percentage point rate decline since the October 2022 peak.
In the third week of January, 57% of borrowers locking in rates paid at least a half-point as part of a permanent buy-down, 44% paid at least a full point, and nearly a quarter bought down their rates with 2 points or more.
Overall, borrowers paid an average of 1.25 points, down from a peak of 2.03 points last fall, at an average cost of $4,300 per borrower for the week ending Jan. 21, 2023, vs. $6,900 for the week ending Oct. 1, 2022
The Mortgage Bankers Association saw mortgage applications increase 7.4% last week, noting: “Purchase activity that was put on hold last year…is gradually coming back as rates ease and housing demand remains strong.”
Freddie Mac’s chief economist observed that with the recent rate drop for the 30-year fixed-rate mortgage, “interested homebuyers are easing their way back to the market just in time for the spring homebuying season.”
Single-family existing-home sales prices climbed in almost 90% of measured metro areas – 166 of 186 – in the fourth quarter. The national median single-family existing-home price increased 4.0% from one year ago to $378,700.
The monthly mortgage payment on a typical existing single-family home with a 20% down payment was $1,969 – up 58% year-over-year.
Less than a fifth of metro markets (18%) posted double-digit annual price appreciation (46% in the previous quarter).
DID YOU KNOW… The NAR reports the median sale price for single-family existing homes climbed 4% in Q4, a deceleration from Q3’s 8.6% increase—plus, around 1 in 10 metros across the U.S. saw price decreases.
CPI was revised HIGHER for October through December.. What was actually revised were the seasonal adjustments, and thereby the seasonally adjusted month-to-month CPI readings that everyone is talking about as a measure of current inflation, whether it’s accelerating or slowing down.
The services CPI was revised to a red-hot +0.7% for December from November (originally 0.6%). And it was also revised up for November and October. This chart shows the revised services CPI (red) and the original (green).
The core CPI was also revised up for October, November, and December, showing much less “disinflation” in October and November, and accelerating inflation in December. The revisions also took out some of the spikes in 2022 and 2021. The red line shows the revised core CPI, green is the original version:
“The market can remain irrational longer than you can remain solvent.” - J. M. Keynes (English economist & philosopher 1883-1946)
Inflation report due Tuesday has the potential to deliver some bad news… All market eyes tomorrow will be on the release of the Labor Department’s consumer price index, a widely followed inflation gauge. Economists are expecting that the CPI will show a 0.4% increase in January, which would translate into 6.2% annual growth. However, there’s some indication the number could be even higher.
With the Fed keen on fighting inflation, this report could harden their position.
30 Year: 3.792% +12.7bps
(Last reading: 3.665%)
10 Year: 3.719% +11.7bps
(Last reading: 3.602%)
5 Year: 3.923% +18.0bps
(Last reading: 3.743%)
2 Year: 4.534% +15.82bps
(Last reading: 4.391%)
Note: The 2 year and 10 year spread (as shown below) remains inverted at an 81 basis point spread. The spread increased one basis point from last week's reading as the 10 year and the 2 year both rose week-over-week.
Southern Nevada Absorption Rate
remains elevated as inventory continues
its decline and sales remain steady
Current ARF:
23.75%
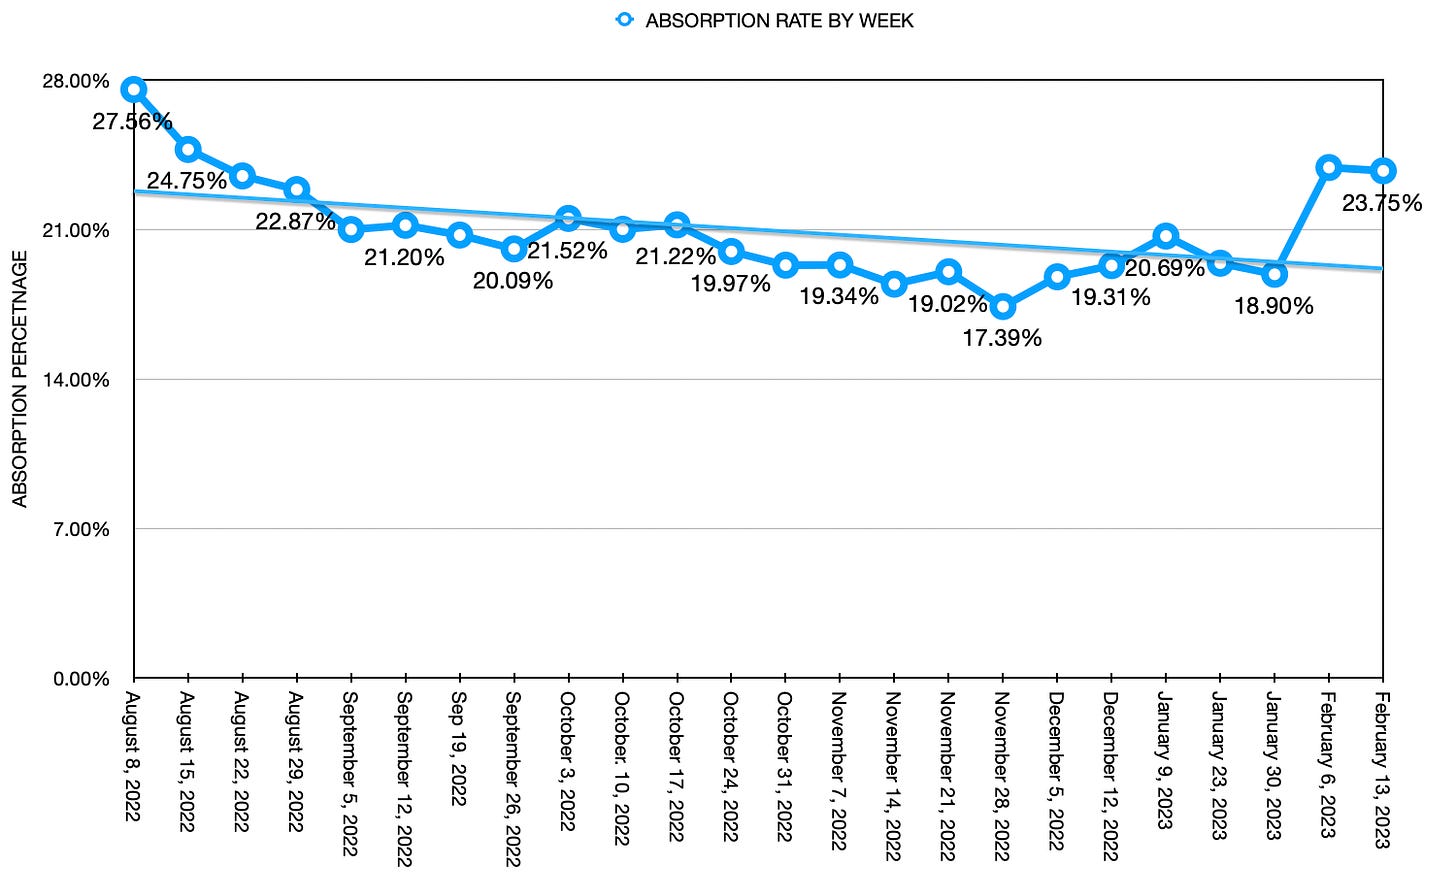
The current absorption rate for the Southern Nevada market the past 30 days is 23.75%, down 15 basis points (0.15%) from the last absorption rate reading on February 6, 2023 (23.90%).
There is about 4.21 months of inventory available on the Southern Nevada housing market. 6 months of inventory is considered an even buyers & seller’s market.
A market with an absorption rate at or above 20% is typically called a seller’s market, whereas an absorption rate below 15% signals a buyer’s market.
Single family home medians are now down $5,000 from January Condo median prices remain unchanged from last weeks reading and townhomes slid further to $286,500.
Each week we will update the current median price for the current month. Keep in mind the majority of sales occur at the end of the month, so official numbers will be published on the first Monday of each month. Current median prices are calculated from 662 closed listings on the MLS (as of Mon. Feb 13, 23)
Currently for the month of February 2023
Single Family
$420,000
-$5,000
Down from January of $425,000
Condo
$208,000
-$7,674
Down from January of $215,674
Townhomes
$286,500
-$38,500
Down from January of $325,000
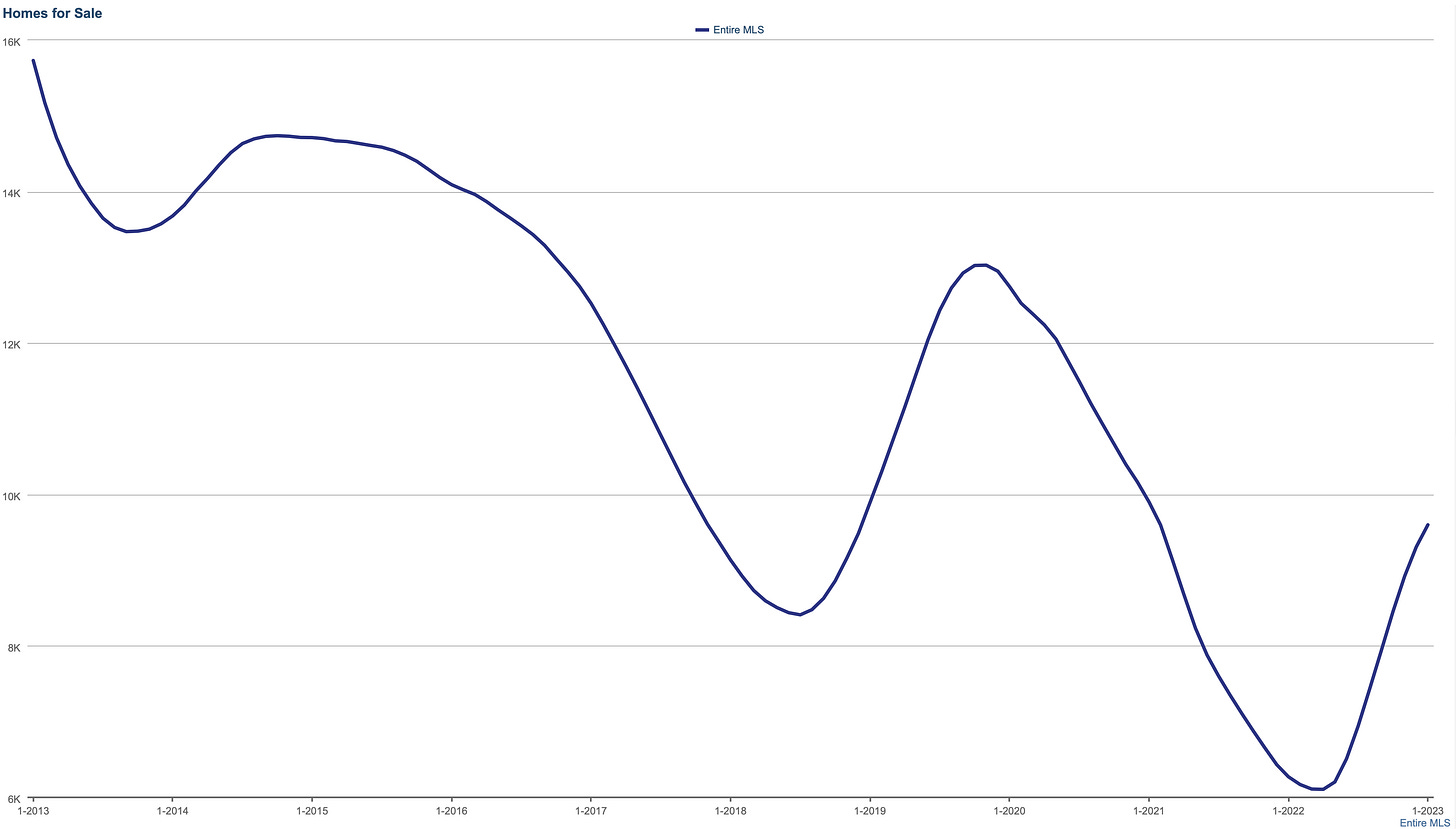
Another decline decline in inventory this week after peaking to 11,344 available properties in October '22. Accepted contingent offers rose again to 910 for the past 7 days and sales dipped slightly week-over-week. Condos, townhomes and high-rises did increase in available inventory this week as single-family and manufactured home slid south.
There are currently 7,554 active single family homes, townhomes, condominiums, high-rises, manufactured and multi-families available on the market. Available rental properties also dipped 1.46% down to 3,504 active rentals on the market.
Homes For Sale (Past 10 Years)
Closed Sales (Past 10 Years)
As of February 13, 2023, there are currently active (w/w change):
5,708 Single Family Homes (-174) -3.05%
775 Condos (+16) +2.11%
535 Townhouses (+25) +4.67%
272 Manufactured Homes (-2) -0.73%
347 High Rise Units (+2) +0.58%
69 Multiple Dwellings (+1) +1.47%
2,490 Parcels of Land (+21) +0.85%
3,504 Rentals On Market (-52) -0.86%
Past Seven Days Market Watch (w/w change):
760 New Listings (+42) +5.85%
185 Back on Market (+13) +7.56%
89 Price Increases (+23) +38.85%
715 Price Decreases (-34) -4.54%
910 Accepted an Offer (+26) +2.94%
442 Sold (-69) -13.50%
160 Expired (-244) -60.40%
335 Taken Off Market (-10) -2.90%
This week, there are 135 less active residential resale properties on the market compared to the last read on February 6, 2023 for a total of 7,554 (-135) a decrease of 1.75%.
In today’s housing market, you can still be the champion if you have the right team and strategy.
To win as a buyer, you need to build your team, make strategic plays, consider what’s in and out of bounds, and stand out from the crowd.
Let’s connect today to make your game-winning play.
HOME BUILDING, INFLATION, RETAIL SALES... January Housing Starts are expected to be off a tad, but Building Permits should be up, a positive sign for future activity. The January Consumer Price Index (CPI) is forecast to show a gain in inflation, while the Producer Price Index (PPI) is predicted to report the same for wholesale prices. Ending on a good note, January Retail Sales are expected up after December's decline.
U.S. financial markets will be closed next Monday, February 20, in observance of Presidents’ Day/Washington’s Birthday.
Forecasting Federal Reserve policy changes in coming months. Fed watchers expect the Fed to keep its foot on the gas, with quarter percent rate hikes in March and May, then put on the brakes in June. Note: In the lower chart a 90.8% probability of change is a 90.8% probability the rate will rise. Current rate is 4.50%-4.75%.
AFTER FOMC MEETING ON: CONSENSUS
Mar 22 4.75%-5.00%
May 3 5.00%-5.25%
Jun 14 5.00%-5.25%
Probability of change from current policy:
AFTER FOMC MEETING ON: CONSENSUS
Mar 22 90.8%
May 3 80.3%
Jun 14 89.2%


