Housing & Economic Update: Key Insights You Need to Know
Your Market Pulse for the week of March 13, 2023

For the week of March 13, 2023

“You can’t teach people to be lazy—either they have it, or they don’t.”—Dagwood Bumstead, a main character in Chic Young’s comic strip Blondie
🏦 REGIONAL BANKS FAILING
🔨 NEW HOME SALES OFF TO STRONG START
☄️ VEGAS INVENTORY CRATERING
📖 NEW CORELOGIC REPORT
We hope you enjoy this edition of the ⚡️ market pulse. Our goal is to analyze and keep you informed on the economy and real estate market so you can make better, informed decisions. We’re here to help you with your real estate needs (residential, commercial & investments) when you’re ready.
Call/text us at (702) 721-7332 or e-mail Jordan@DoveandAssociates.com
WATCH ON YOUTUBE


Following Fed Chair Powell's hawkish Congressional testimony, the February jobs report, and the FDIC's shutdown of Silicon Valley Bank (SVB) to protect insured depositors, we saw stocks take a big hit.
As of March 13, 2023, the financial sector is taking a big hit in the market while the three major indices stay positive thus far. While SVB was the 16th largest banking institution in the U.S. with specialized lending practices, its shutdown should only be a temporary shock to Wall Street. The $19.8 trillion U.S. banking system remains very well capitalized, and is going to give an opportunity for larger banks to absorb the smaller ones in a “fire sale.” Probably not the healthiest move for consumers long-term.
Powell told Congress that the Fed still has more work to do to cool the economy and inflation, but we later got February's weak 0.2% gain in hourly earnings and rising 3.6% unemployment rate to show that the Fed's making progress. However, the week ended with the Dow down 4.4%, to 31,910, the S&P 500 down 4.5%, to 3,862, and the Nasdaq down 4.7%, to 11,139.
Bond prices overall benefited from a flight to safety, although the UMBS 6.0% slipped 0.71, to $100.31. In Freddie Mac's Primary Mortgage Market Survey, the national average 30-year fixed mortgage rate edged up again. Remember, mortgage rates can be extremely volatile, so check with your mortgage professional for up-to-the-minute information.

Home building data firm Zonda revealed most builders saw a strong start to the year. Their New Home Pending Sales Index (PSI) reported a nonseasonally adjusted 4.3% uptick in demand in January.
Fannie Mae’s February Home Purchase Sentiment Index found most consumers still think it's a good time to sell a home and the share of those who say it's a good time to buy went up 5% from January.
A panel of housing experts surveyed by Zillow and Pulsenomics believes home price growth will pick up again in 2024, hitting a 3.5% annual growth rate every year through 2027, a reassuring prediction for this year’s buyers.
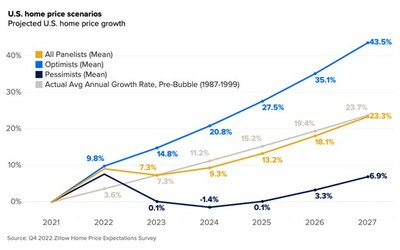
The panel forecasts prices to slide 1.6% in 2023; growth over the following four years is expected to average 3.5%, equivalent to the long-term average.
New home sales are expected to decline to near 2016 levels this year.
Sales of both new and existing single-family homes are expected to slide in 2023.
DID YOU KNOW… CoreLogic reports annual home price growth fell to 5.5% in January, slowing for the ninth straight month. Their chief economist sees “price declines modest, which are projected to top at 3% peak to trough
Top Takeaways from the CoreLogic Report:
U.S. home prices (including distressed sales) increased by 5.5% year over year in January 2023 compared to January 2022. On a month-over-month basis, home prices declined by 0.2% compared to December 2022.
In January, the annual appreciation of attached properties (6.5%) was 1.3 percentage points higher than that of detached properties (5.2%).
CoreLogic forecasts show annual U.S. home price gains slowing to 3.1% by January 2024.
Miami posted the highest year-over-year home price increase of the country’s 20 largest metro areas in January, at 17.3%, while Tampa, Florida continued to rank second at 11.7%.
Florida and Maine recorded the highest annual home price gains, 13.4% and 11.5%, respectively. South Carolina posted the third-highest gain, with a 10.7% year-over-year increase. Three states and one district registered year-over-year price declines: Idaho (-2.3%), Washington (-2.2%), Montana (-0.6%) and Washington, D.C. (-0.1%).

Something broke, but the Fed is still expected to go through with rate hikes
Markets still expect the Fed to keep up its inflation-fighting efforts, despite high-profile bank failures that have rattled the financial system.
Traders on Monday assigned an 85% probability of a 0.25 percentage point interest rate increase when the Federal Open Market Committee meets March 21-22.
Goldman Sachs was virtually alone when it said it expects the central bank to pass on a rate hike next week.
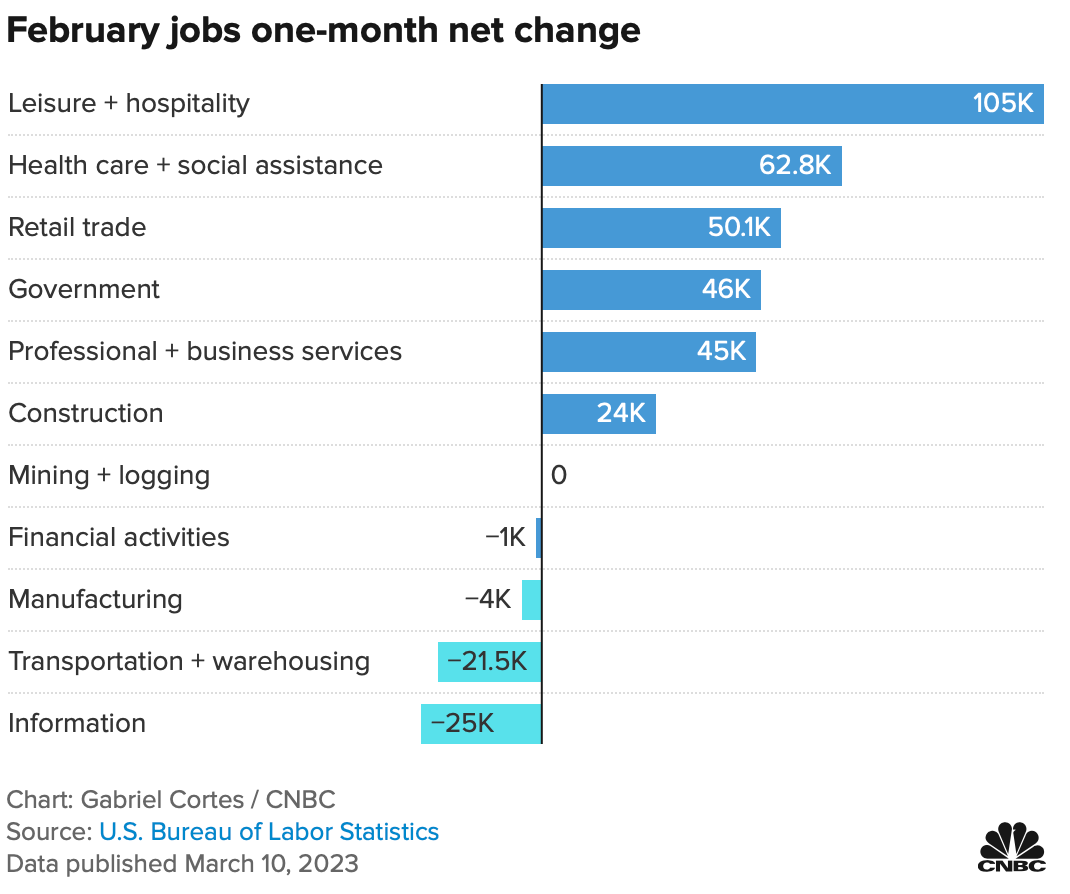
Here’s where the jobs are for February 2023 — in one chart
2-year Treasury yield posts biggest 3-day decline since aftermath of 1987 stock crash
Investors swarmed into U.S government bonds Monday after the collapse of Silicon Valley Bank and subsequent government backstop of the banking system. The rush sent Treasury yields tumbling.
The yield on the 2-year Treasury was last trading at 4.06% down 53 basis points. (1 basis point equals 0.01%. Prices move inversely to yields.)
The yield has fallen 100 basis points, or a full percentage point, since Wednesday, marking the largest three-day decline since Oct. 22, 1987, when the yield fell 117 basis points. That move followed the Oct. 19, 1987 stock market crash — known as “Black Monday” in which the S&P 500 plunged 20% for its worst one-day drop. The move was bigger than the 2-year yield slide of 63 basis points that took place in three days following the 9/11 attacks.


Sales remain steady while inventory continues cratering keeping the Southern Nevada market at an elevated Absorption Rate Figure
Current ARF:
39.41% 🤯

The current absorption rate for the Southern Nevada market the past 30 days is 39.41%, up 6.38% 😱 (638 basis points) from the last absorption rate reading on March 6, 2023 (33.03%).
There is about 2.54 months of inventory available on the Southern Nevada housing market. Historically, 6 months of inventory is considered an even buyers & seller’s market, although we at D&A believe that 4 months is an even buyers & sellers market.
A market with an absorption rate at or above 20% is typically called a seller’s market, whereas an absorption rate below 15% signals a buyer’s market. 15-20% in considered an even market.

Each week we will update the current median price for the current month. Keep in mind the majority of sales occur at the end of the month, so official numbers will be published on the first Monday of each month. Median prices are of 985 sold listings from the MLS as of March 13, 2023.
Currently for the month of March 2023
Single Family
$425,000
+$10
Up from February of $424,990
Condo
$219,400
-$854
Down from February of $220,254
Townhomes
$325,000
+$15,500
Up from February of $309,500
Resale inventory continues to crater as accepted offers and sales continue to pick up steam.
Accepted contingent offers remain elevated with 958 this week. Sales also remain steady compared to previous months with 630 closing the last 7 days, a 23.29% increase from one month ago.
There are currently 6,641 active single family homes, townhomes, condominiums, high-rises, manufactured and multi-families available on the market. Available rental properties also dipped 11.75% month-over-month to 3,138 active rentals on the market.

As of March 13, 2023, there are currently active (4w change):
4,780 Single Family Homes (-928) -16.26%
716 Condos (-43) -5.66%
490 Townhouses (-45) -8.41%
253 Manufactured Homes (-21) -7.66%
339 High Rise Units (-6) -1.74%
63 Multiple Dwellings (-5) -7.35%
2,501 Parcels of Land (+32) +1.30%
3,138 Rentals On Market (-418) -11.75%
Past Seven Days Market Watch (4w change):
696 New Listings (+22) +3.06%
188 Back on Market (+16) +9.30%
64 Price Increases (-2) -3.03%
616 Price Decreases (-133) -17.76%
958 Accepted an Offer (+74) +8.37%
630 Sold (+119) +23.29%
108 Expired (-296) -73.27%
304 Taken Off Market (-41) -11.88%
This week, there are 240 less active residential resale properties on the market compared to the last read on March 6, 2023 for a total of 6,641 - a decrease of 3.49%.


HOME BUILDING, RETAIL SALES, INFLATION… We should see an uptick in builder activity in February, with Housing Starts and Building Permits ahead for the month. Economists expect a slight increase in Retail Sales for February, a slight decrease when you don't count auto sales. They also see inflation slowing in both the Consumer Price Index (CPI) and the wholesale Producer Price Index (PPI).


If you’re trying to decide whether to rent or buy a home, there are a few things you should consider.
Homeownership can help you escape the cycle of rising rents, builds your wealth, and serves as a hedge against inflation.
If you’re ready to take advantage of the benefits of homeownership, let’s connect to explore your options.

Forecasting Federal Reserve policy changes in coming months. Despite Fed Chair Powell’s hawkish testimony before Congress, the futures market sees only a quarter percent rate hike at the next two FOMC meetings, then no hike in June. Note: In the lower chart, a 100% probability of change is a 100% probability the rate will rise. Current rate is 4.50%-4.75%.
AFTER FOMC MEETING ON: CONSENSUS
Mar 22 4.75%-5.00%
May 3 5.00%-5.25%
Jun 14 5.00%-5.25%
Probability of change from current policy:
AFTER FOMC MEETING ON: CONSENSUS
Mar 22 100.0%
May 3 84.9%
Jun 14 90.8%


With gratitude,


Jordan C. Dove, ABR® SFR®
MANAGING PRINCIPAL | REALTOR®
Dove & Associates Powered by Nationwide Realty
702.767.5557 | Jordan@DoveandAssociates.com
JordanDove.com | DoveandAssociates.com
Subscribe to my YouTube Channel
3960 E. Patrick Ln. Ste. 204
Las Vegas, NV 89120
NV Lic. # S.0180594