

🏡 MARKET PULSE: Disappointing Home Sales & Housing Starts
For the week of October 25, 2022


Disappointing Home Sales & Housing Starts
"If the freedom of speech is taken away then dumb and silent we may be led, like sheep to the slaughter.” - George Washington

National Market Update
Existing Home Sales dipped 1.5% in September, down for the eighth month in a row, their longest losing streak since 2007. But the last two months posted the smallest declines this year, so sales may be stabilizing. Let’s hope so. However, sales were down 23.8% when compared to September of last year. This is a critical information for taking the pulse of the housing market, as it measures closing on existing homes, which represents around 90% of the housing market.
On a national level, the number of available homes declined for the second month in a row, from 1.8 million at the end of August to 1.25 million at the end of September. This equates to a 3.2 months’ s supply of homes. However, there were only 732,000 “active listings” in September, which means that 41% of the “inventory” in the Existing Home Sales report is under contract and not truly available. This speaks to demand, as a normal market has 25% of inventory under contract. When looking at the months supply of available homes, it’s really 1.9 months.
However, the Northeast and Midwest part of the country is still seeing a Hot housing market which is propping up these national numbers, but areas such as the West, Southwest and South and seeing massive rises in inventory and price decreases.
After an August rebound, Housing Starts resumed their path downward in September, off 8.1%. But good news came with Building Permits up 1.4%, though this was all due to the multi-unit sector.

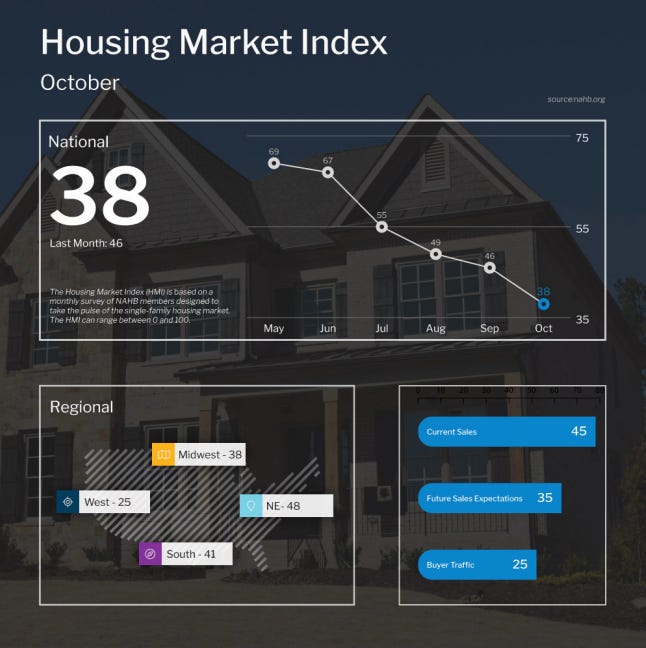
Builders are cautious about single-family home demand because of higher mortgage rates. The NAHB homebuilder sentiment index is at 38, its lowest level in ten years. Below 50 means more builders see conditions as poor vs. good.
DID YOU KNOW… Even though Existing Home Sales were down in September, demand stayed up. Buyer urgency was so high that 70% of the homes sold were on the market less than a month! However, these properties that closed in September are from accepted contracts in July and August.
Economic Notes
The number of people filing for unemployment benefits for the first time fell by 12,000 in the latest week, as 214,000 Initial Jobless Claims were reported. This decline followed increases of 29,000 and 7,000 in the previous two weeks’ filings. Continuing Claims, which measure people who continue to receive benefits after their initial claim is filed, rose 21,000 to 1.385 million.
A number of major manufacturing indices, including those for the New York and Philadelphia regions, have all reported negative numbers far worse than expectations. In New York, October’s Empire State Index was more than twice as bad as anticipated, marking the third straight month below zero, while the Philadelphia Fed Index saw a second straight month in negative territory.
This data follows recent headlines out of the Financial Times and Wall Street Journal, which included, “Global Economic Warning Lights are Flashing Red,” “Risks of a Deeper Global Slump Escalate,” and “Economists Now Expect a Recession, Job Losses by Next Year.”
The International Monetary Fund also cut its global growth outlook for 2023, warning that recession risks are rising and the “worst is yet to come” for the global economy. The Fed’s latest Beige Book, which is a summary of commentary on current economic conditions, also featured the word recession a record high thirteen times.
INVERTED YIELD CURVE WATCH
30 Year Treasury Yield: 4.36% (Last week’s reading: 4.014%)
10 Year Treasury Yield: 4.215% (Last week’s reading: 4.002%)
5 Year Treasury Yield: 4.341% (Last week’s reading: 4.232%)
2 Year Treasury Yield: 4.503% (Last week’s reading: 4.454%)
LOCAL MARKET UPDATE
CLARK COUNTY & NYE COUNTY, NV
Absorption Rate dips below 20% for the first time in over two years.
The absorption rate for Clark County & Nye County, NV has dipped below 20% for the first time in over two years. This measure of supply & demand continues its trend down in a cooling housing market in Southern Nevada.
Clark County, NV Absorption Rate
19.97%
The current absorption rate for the Southern Nevada market the past four weeks is 19.97%, down 1.25% from last week's absorption rate. This is the first time since before the pandemic that the Absorption Rate Figure (ARF) has dipped BELOW the 20% mark. This marks three consecutive weeks of a decline and a decrease in 11 of the last 13 readings.

A market with an absorption rate at or above 20% is typically called a seller’s market, whereas an absorption rate below 15% signals a buyer’s market.
Each week we will update the current median price for the current month. Keep in mind the majority of sales occur at the end of the month, so official numbers will be published on the first Monday of each month.
Current October 2022 Median Prices
Single Family
$440,000 (-$10,000)
(Down from September of $450,000)
Condo
$226,000 (-$4,000)
(Down from September of $230,000)
Townhouse
$325,000 (+$5,000)
(Up from September of $320,000)

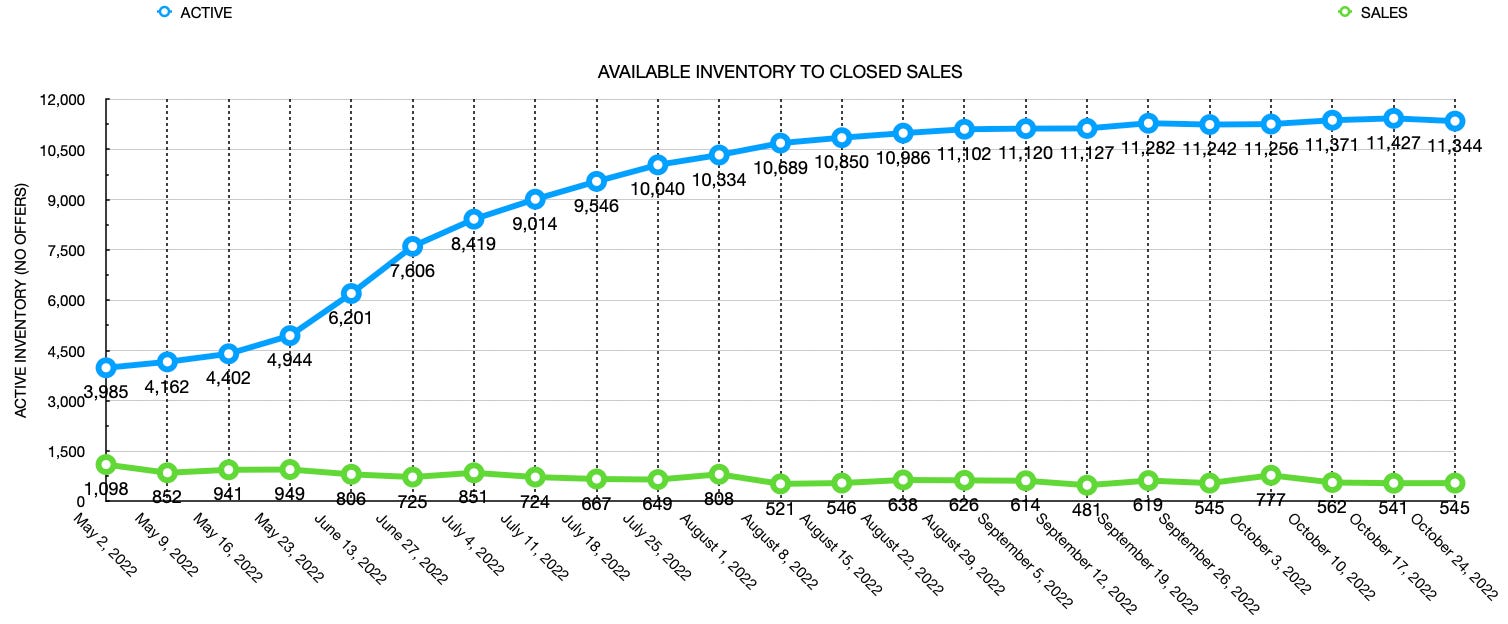
This week shows a slight decline in inventory. This week marks the 2nd time in 4 weeks that inventory shows a week-over-week decline. However, the past 29 of 31 weeks have seen an increase of available inventory. Chart below shows total available inventory to total weekly closed sales. (Last updated October 24, 2022)
As of October 24, 2022, there are currently active (%’s versus 1 weeks ago):
8,575 Single Family Homes (-33) -0.38%
1,130 Condos (-14) -1.22%
780 Townhouses (-19) -2.38%
317 Manufactured Homes (-8) -2.16%
449 High Rise Units (-4) -0.88%
93 Multiple Dwellings (-6) -0.61%
2,697 Parcels of Land (+101) +3.89%
3,590 Rentals On Market (+21) +0.59%
Past Seven Days Market Watch (%’s versus 4 week ago):
969 New Listings (-8) -0.82%
223 Back on Market (+10) +4.69%
86 Price Increases (+/-0) +/- 0.00%
1,657 Price Decreases (-232) -12.28%
740 Accepted an Offer (-24) -3.14%
617 Sold (-72) -13.21%
128 Expired (+20) +18.52%
587 Taken Off Market (+39) +7.12%
57* properties are coming soon (-8) -12.50%
This week, there are 83 less active residential resale properties on the market compared to one week ago for a total of 11,344 (-83), a decrease of 0.73%.
*Properties coming soon do not indicate all of the upcoming properties. These are listing that are entered into the MLS prior to list date.
FEATURED LISTING


REVIEW OF LAST WEEK
TRADERS DON THEIR RALLY CAPS... Friday, traders sent the three major indexes to their biggest weekly gains since June on indications the Fed might back off from its aggressive pace of rate hikes this year.
Those indications came from comments by the San Francisco Fed president and a Wall Street Journal article suggesting the Fed will hike rates by 75 basis points (0.75%) in November but possibly do a smaller increase in December.
A big negative was the Treasury's report of a $430 billion September deficit, up massively from $65 billion just one year ago. However, generally better-than-expected Q3 corporate earnings provided a nice tailwind for the rally.
The week ended with the Dow UP 4.9%, to 31,083; the S&P 500 UP 4.7%, to 3,753; and the Nasdaq UP 5.2%, to 10,860.
With investors flocking to surging equities, bond prices fell, the 30-year UMBS 5.5% down 0.82, to $97.27. In Freddie Mac's Primary Mortgage Market Survey, the national average 30-year fixed mortgage rate slowed its rise, up just two basis points (0.02%). Remember, mortgage rates can be extremely volatile, so check with your mortgage professional for up-to-the-minute information.
THIS WEEK’S FORECAST
HOME SALES, CONSUMER SENTIMENT DOWN, INFLATION UP… Expect continued contraction for September New Home Sales and the Pending Home Sales index of contracts on existing homes. The final read on University of Michigan Consumer Sentiment for October should be down too, languishing at historic lows. Unfortunately, forecast to be up are PCE Prices, the Fed's favorite inflation measure.
FED RESERVE WATCH
Forecasting Federal Reserve policy changes in coming months. The futures market now sees a three-quarter-percent rate hike in November, but then half percent hikes in December and February. Note: In the lower chart a 92.2% probability of change is a 92.2% probability the rate will rise. Current rate is 3.00%-3.25%.
AFTER FOMC MEETING ON: CONSENSUS
Nov 2 3.75%-4.00%
Dec 14 4.25%-4.50%
Feb 1 4.75%-5.00%
Probability of change from current policy:
AFTER FOMC MEETING ON: CONSENSUS
Nov 2 92.2%
Dec 14 96.4%
Feb 1 62.4%