

📰 Your weekly inside scoop on real estate
For the week of October 30, 2023


“Great things are done by a series of small things brought together.”
- Vincent Van Gogh

We’re here to help you with your real estate portfolios &
solar energy solutions. Respond to this e-mail with any questions.
🕵🏼♀️ TIP OF THE WEEK:
Unmasking Scary Myths About Today’s. Housing Market (Infographic)

CORRECTION TERRITORY... That's where the S&P 500 and the Nasdaq landed, having fallen 10% below their recent highs in late July. The Dow isn't quite there yet, though it posted another down week.
Problems included high bond yields and Core PCE Prices, the Fed's favorite measure of inflation, down a bit, but at 3.7%, still well above the Fed's 2% target. Both point to the Fed's keeping rates higher for longer.
Advanced Q3 GDP had the economy growing at a hefty 4.9%, plus consumer spending and business investment were both up. So, the economy is too strong for the Fed to cut rates, but at least we're not in a recession.
The week ended with the Dow down 2.1%, to 32,418; the S&P 500 down 2.5%, to 4,117; and the Nasdaq down 2.6%, to 12,643.
Bond prices sank as well, the 30-Year UMBS 6.5% falling to $99.08. In Freddie Mac's Primary Mortgage Market Survey, the national average 30-year fixed mortgage rate edged up. Remember, mortgage rates can be extremely volatile, so check with your mortgage professional for up-to-the-minute information.

New Home Sales soared 12.3% in September, the biggest gain in more than a year, sending sales up 39.8% over the July 2022 low. Inventories were up by 3,000, while the median selling price was down 12.3% from a year ago.

The Pending Home Sales index of contracts signed on existing homes reversed its recent monthly slides, heading back up in September. This points to increased existing home sales in October and November.
Pending home sales increased in September, up 1.1% from August.
Month over month, contract signings increased in the Northeast, Midwest and South but decreased in the West.
Pending home sales fell in all four U.S. regions compared to one year ago.
The NAR predicts existing home sales will end 2023 down, then rise 13.5% in 2024, the median price up less than 1%. New home sales will be up 4.5% in 2023, and 19.4% in 2024, the median price down 5.9% in 2023, but up 3.5% in 2024.
DID YOU KNOW… Zillow reports that nearly 20% of couples now put “home funds” in their wedding registry, up 55% from 2018. In 2023, 43% of first-time buyers used gift funds from friends and family to help make their down payment
FREE DUTCH BROS ON YOUR B-DAY! ☕️

Become a Solar Ambassador for our solar brokerage & installation company. Have the conversation with a friend, neighbor, family member or colleague and your referral will be compensated $1,000 once the PV system is installed.
You can track the entire process on our platform. Learn more:

As of Monday Oct. 30 2023 09:58 AM PST


Each week we will update the current median price for the current month. These properties include all of Southern Nevada whereby the above graphic is only Clark County, NV.
Keep in mind the majority of sales occur at the end of the month, so official numbers will be published on the first Monday of each month. These median prices are calculated from 1,903 sold October listings in from the MLS as of October 30, 2023. (All counties in the LVR MLS, not just Clark as referenced above.)
CURRENT: OCTOBER 2023 MEDIAN PRICES
Single Family
$445,000
UNCH
Unchanged from September of $445,000
Condo
$232,500
+$2,500
Up from September of $230,000
Townhomes
$340,000
UNCH
Unchanged from September of $340,000

As of October 30, 2023, there are currently active (W/w change):
4,548 Single Family Homes (+108) +2.43%
732 Condos (+33) +4.70%
526 Townhouses (+13) +2.53%
224 Manufactured Homes (-6) -2.61%
328 High Rise Units (-3) -0.90%
70 Multiple Dwellings (-1) -1.40%
2,414 Parcels of Land (+14) +0.58%
3,674 Rentals On Market (+28) +0.76%
Past Seven Days Market Watch (W/w change):
710 New Listings (-13) -1.79%
186 Back on Market (+36) +24.00%
58 Price Increases (+2) +3.57%
585 Price Decreases (-54) -8.45%
606 Accepted an Offer (-34) -5.31%
459 Sold (-130) -22.07% (M/m)
90 Expired (+35) +63.63% (M/m)
232 Taken Off Market (-3) -1.27%
This week, there are 137 more active residential resale properties on the market compared to last week's reading on Oct. 23, 2023 for a total of 6,431 - an increase of 2.76%.

120 SEDRAN PL.
UNDER CONTRACT - 11 OFFERS

Las Vegas, NV 89120 | MLS 2523540
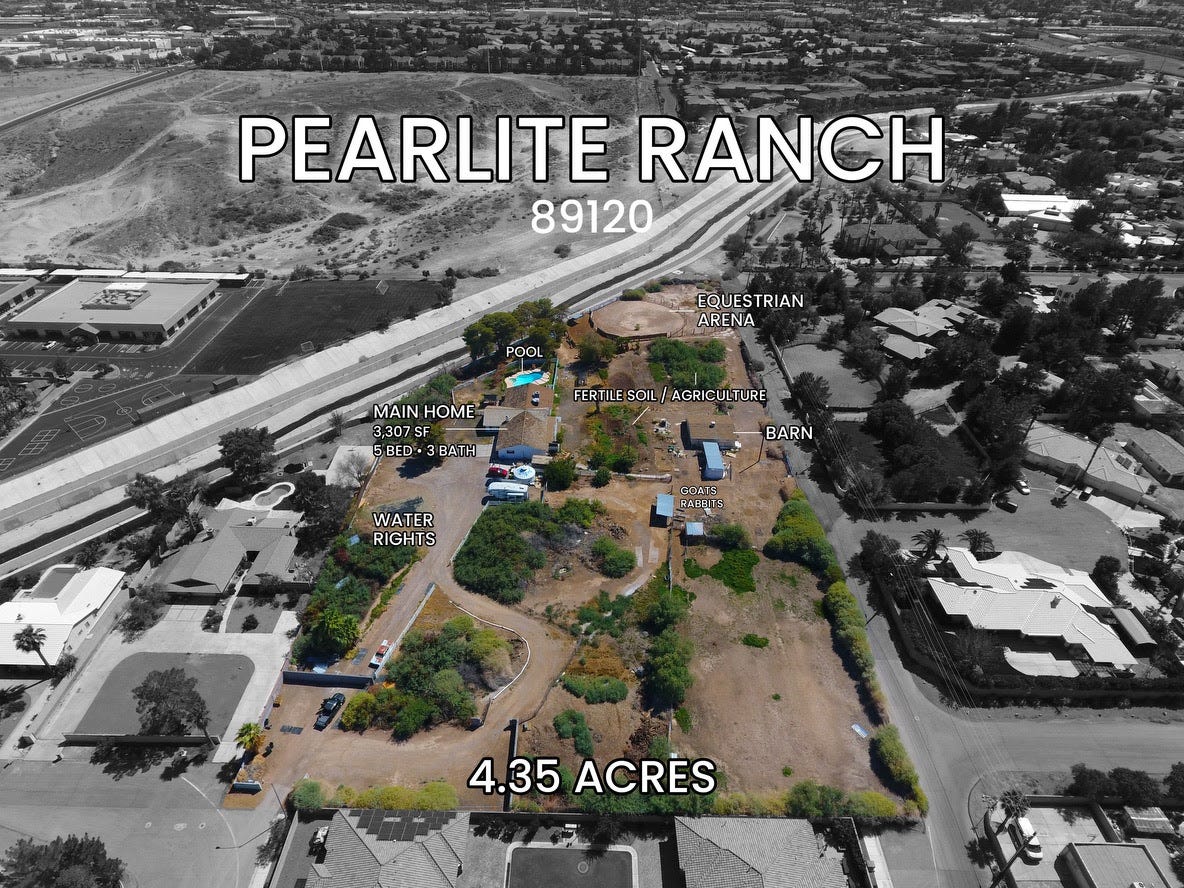
5855 Pearlite Ave.
5 BED | 3 BATHS | 3,307 SF
4.35 ACRES | POOL & SPA
IRREVOCABLE WATER/IRRIGATION RIGHTS (10 ACRE FEET)
EQUESTRIAN ARENA | BARN | FERTILE SOIL
78 RATTLESNAKE GRASS
PRICE IMPROVED TO $568,880

5291 HARRISON DR.
PRICE IMPROVED TO $640,000


CONSTRUCTION SPENDING, HOME PRICES, JOBS, THE FED... September Construction Spending is predicted to be up overall, but our focus will be on the residential sector. The S&P Case-Shiller Home Price Index for August should continue its modest rebound. The October Nonfarm Payrolls report is expected up, though not matching September's blockbuster number. Finally, it's hard to find a single person on Wall Street who thinks the Fed's FOMC Rate Decision will raise the rate.
Here’s what you really need to know about a few myths causing fear in today’s housing market.
Despite common misconceptions, many people can buy a home even if they have student loans, home prices are rising nationally (not falling), and you usually don’t have to have 20% for a down payment.
If you have other fears or reservations about buying a home today, let’s connect so you have an expert to help clear those up.
Forecasting Federal Reserve policy changes in coming months. Virtually no Fed watchers expect the central bank to hike this Wednesday, and most expect today’s rate to hold through the end of January. Note: In the lower chart, a 0.6% probability of change is a 99.4% probability the rate will stay the same. Current rate is 5.25%-5.50%.
AFTER FOMC MEETING ON: CONSENSUS
Nov 1 5.25%-5.50%
Dec 13 5.25%-5.50%
Jan 31 5.25%-5.50%
Probability of change from current policy:
AFTER FOMC MEETING ON: CONSENSUS
Nov 1 0.6%
Dec 13 20.1%
Jan 31 29.1%