
📰 Your weekly inside scoop on real estate
📰 Your weekly inside scoop on real estate
For the week of October 23, 2023

“The very things that hold you down are going to lift you up.” - Dumbo

We’re here to help you with your real estate portfolios &
solar energy solutions. Respond to this e-mail with any questions.
🕵🏼♀️ TIP OF THE WEEK:
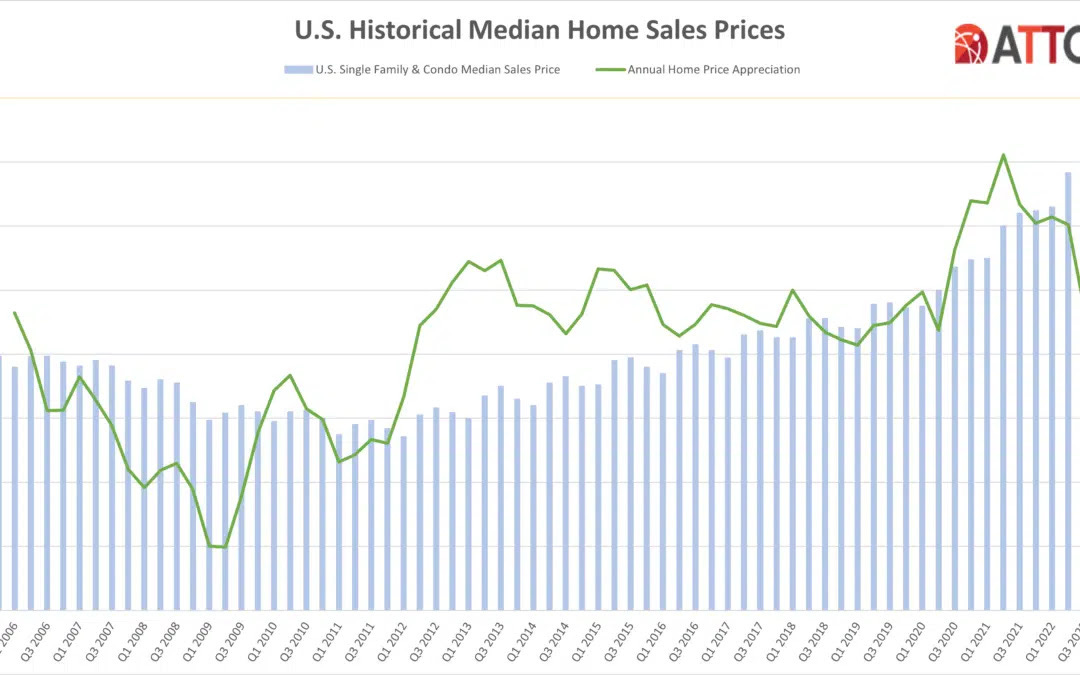
Home Price Growth Is Returning To Normal (Infographic)

WORRY TIMES THREE... Rising Treasury yields, higher oil prices, and concerns about the war in the Middle East created enough worries to have all three major stock indexes book their worst week in a month.
As the price of the 10-year Treasury fell, its yield rose, so investors feared possible higher borrowing costs. In addition, the Leading Economic Index fell in September, as it has for the last eighteen months in a row.
But investors also saw: September Retail Sales up, on healthy consumer spending; initial jobless claims below 200,000, suggesting continued employment growth; and an improving industrial sector.
The week ended with the Dow down 1.6%, to 33,127; the S&P 500 down 2.4%, to 4,224; and the Nasdaq down 3.2%, to 12,984.
Led by Treasuries, bond prices fell overall, the 30-Year UMBS 6.0% dropping 1.15, to $96.16. The national average 30-year fixed mortgage rate inched up just six basis points (0.06%) in Freddie Mac's Primary Mortgage Market Survey. Remember, mortgage rates can be extremely volatile, so check with your mortgage professional for up-to-the-minute information.

Builders increased activities in September, sending Housing Starts back up, by 7.0% over August. Starts for single-families are now up 8.6% the past year, as tight existing home inventories are driving buyers to new builds.

Building Permits slipped in September, all due to multifamilies. Single-family permits rose, as they've done every month since February. And the number of homes under construction is near the highest level on record.
Tight inventories sent monthly Existing Home Sales down in September. The supply of homes for sale, at 3.4 months, is well below the 5 months of a normal market, while the median price is up 2.8% from a year ago.
Existing-home sales slid 2.0% in September to a seasonally adjusted annual rate of 3.96 million. Sales retreated 15.4% from one year ago.
The median existing-home sales price grew 2.8% from one year ago to $394,300, marking the third consecutive month of year-over-year price increases.
The inventory of unsold existing homes climbed 2.7% from the prior month to 1.13 million at the end of September, or the equivalent of 3.4 months' supply at the current monthly sales pace.
DID YOU KNOW… Sellers should take note that in the third quarter, profit margins on median-priced single-family and condo sales increased to almost 60%, as the median home price nationwide hit a new high of $350,000.

Become a Solar Ambassador for our solar brokerage & installation company. Have the conversation with a friend, neighbor, family member or colleague and your referral will be compensated $1,000 once the PV system is installed.
You can track the entire process on our platform. Learn more:

As of Monday Oct. 23 2023 10:25 AM PST


Each week we will update the current median price for the current month. These properties include all of Southern Nevada whereby the above graphic is only Clark County, NV.
Keep in mind the majority of sales occur at the end of the month, so official numbers will be published on the first Monday of each month. These median prices are calculated from 1,446 sold October listings in from the MLS as of October 16, 2023. (All counties in the LVR MLS, not just Clark as referenced above.)
CURRENT: OCTOBER 2023 MEDIAN PRICES
Single Family
$444,995
-$5.00
Down from September of $445,000
Condo
$234,888
+$4,888
Up from September of $230,000
Townhomes
$340,990
+$990
Up from September of $340,000

As of October 23, 2023, there are currently active (W/w change):
4,440 Single Family Homes (+103) +2.37%
702 Condos (+17) +2.45%
513 Townhouses (+14) +2.80%
230 Manufactured Homes (+4) +1.77%
331 High Rise Units (+2) +0.60%
71 Multiple Dwellings (+4) +5.97%
2,400 Parcels of Land (+20) +0.84%
3,646 Rentals On Market (-44) -1.19%
Past Seven Days Market Watch (W/w change):
723 New Listings (+33) +4.78%
150 Back on Market (+17) +12.78%
56 Price Increases (-16) -22.22%
639 Price Decreases (+31) +5.09%
640 Accepted an Offer (-46) -6.70%
533 Sold (-56) -9.50% (M/m)
85 Expired (+30) +54.54% (M/m)
235 Taken Off Market (+22) +10.32%
This week, there are 104 more active residential resale properties on the market compared to last week's reading on Oct. 16, 2023 for a total of 6,294 - an increase of 1.68%.
FEATURED PROPERTIES
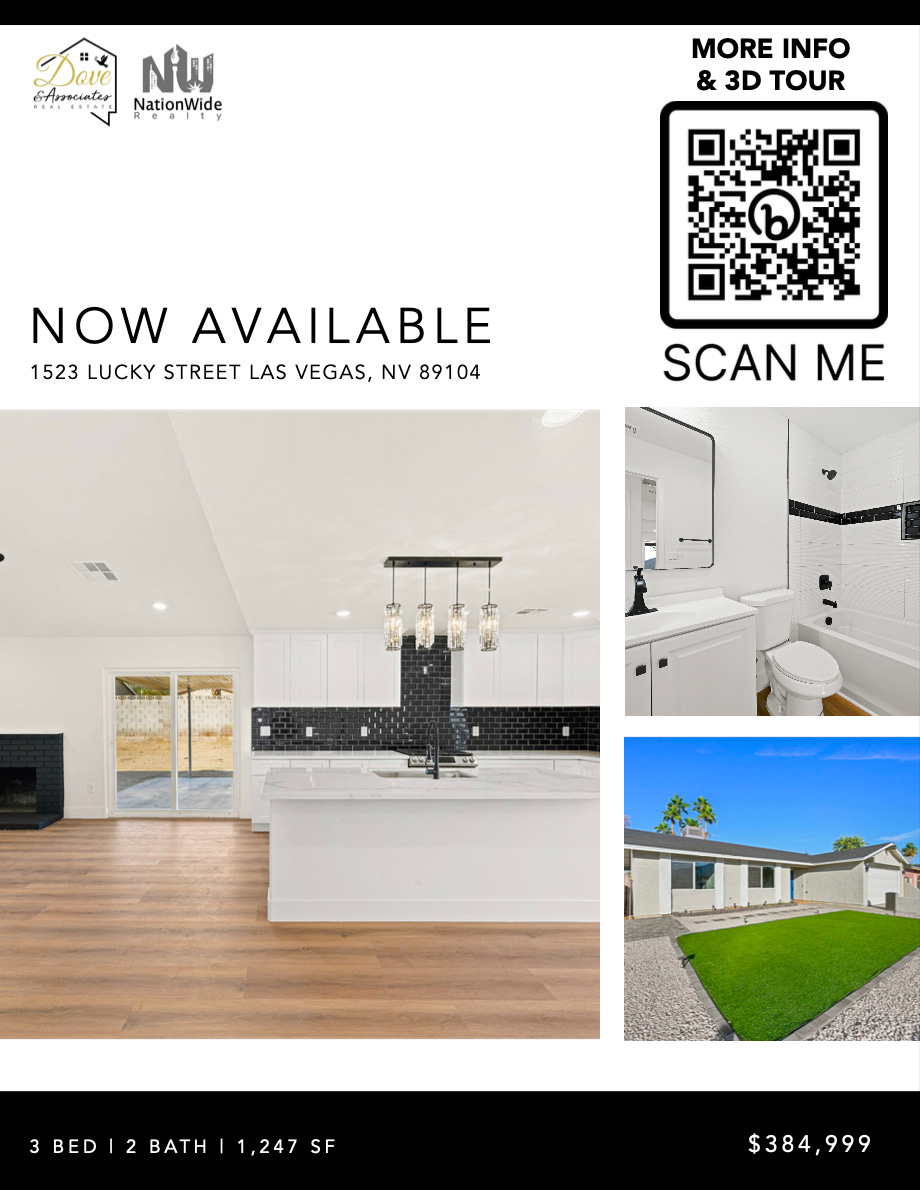


Las Vegas, NV 89120 | MLS 2523540
5855 Pearlite Ave.
5 BED | 3 BATHS | 3,307 SF
4.35 ACRES | POOL & SPA
IRREVOCABLE WATER/IRRIGATION RIGHTS (10 ACRE FEET)
EQUESTRIAN ARENA | BARN | FERTILE SOIL


NEW AND PENDING HOME SALES, GDP, INFLATION… September should see New Home Sales continuing to rise, and, happily, the Pending Home Sales index of signed contracts on existing homes is also expected to gain. The Advanced GDPread for Q3 is predicted to show economic growth at 4%, not exactly cooling under the Fed's rate hikes. But the Fed's favorite inflation measure, Core PCE Prices, is forecast up at a slightly slower pace.

If you're wondering what’s happening with home prices, know they’re still rising, just at a slower pace – and that’s perfectly normal for this time of year.
Based on typical seasonality in the market, prices go up most in the spring during the peak buying season, and then price growth slows down as the year goes on.
Home prices aren’t falling. They’re just rising slower and going back to normal seasonal trends. That’s a good thing. If you're curious about prices in our area, let’s connect.
Forecasting Federal Reserve policy changes in coming months. Most Fed watchers see no rate hikes through the end of January, but they don’t expect any rate cuts either. Note: In the lower chart, a 1.7% probability of change is a 98.3% probability the rate will stay the same. Current rate is 5.25%-5.50%.
AFTER FOMC MEETING ON: CONSENSUS
Nov 1 5.25%-5.50%
Dec 13 5.25%-5.50%
Jan 31 5.25%-5.50%
Probability of change from current policy:
AFTER FOMC MEETING ON: CONSENSUS
Nov 1 1.7%
Dec 13 25.7%
Jan 31 34.7%

Seamless Aesthetics
150 East Centennial Pkwy. Suite # 103 North Las Vegas, NV 89084
(702) 602-2534 | seamlessaesthetics@outlook.com

Stake Out Bar - Under New Ownership
4800 S. Maryland Pkwy Ste. A
Las Vegas, NV 89119
Across from UNLV
With gratitude,

Jordan C. Dove, ABR® SFR®
MANAGING PRINCIPAL | REALTOR®
Dove & Associates Powered by Nationwide Realty
702.767.5557 | Jordan@DoveandAssociates.com
JordanDove.com | DoveandAssociates.com
Subscribe to my YouTube Channel
3960 E. Patrick Ln. Ste. 204
Las Vegas, NV 89120
NV Lic. # S.0180594

© Copyright 2023 Dove & Associates, LLC at Nationwide Realty, LLC.
3960 E. Patrick Ln. #204
Las Vegas, NV 89120
This e-mail is an advertisement for Jordan Dove. The material provided is for informational and educational purposes only and should not be construed as investment, real estate and/or mortgage advice, or a commitment to lend. Although the material is deemed to be accurate and reliable, there is no guarantee of its accuracy. The material contained in this message is the property of Dove and Associates, LLC and cannot be reproduced for any use without prior written consent. The material does not represent the opinion of Dove and Associates, LLC at Nationwide Realty, LLC. This information is subject to change.