
📰 Your weekly inside scoop on real estate
📰 Your weekly inside scoop on real estate
For the week of September 4, 2023

For the week of September 4, 2023

“The more we value things outside of our control, the less control we have.” - Marcus Aurelius
🕵🏼♀️ TIP OF THE WEEK: Homeowners have A LOT Of Equity Right Now (Infographic)

NOT TOO BAD, NOT TOO GOOD... Traders sent stocks up for the week on a batch of mildly up and mildly down economic data that made them feel the Fed would keep interest rates on pause and the economy might see a soft landing.
The August jobs report showed a cooling labor market, with a net gain of only 77,000 nonfarm payrolls after the prior two months' increases were revised down. Q2 GDP slipped to 2.0% and manufacturing is still contracting.
But economic strength was shown in continued low initial unemployment claims, and healthy gains in consumer income and spending. PCE inflation saw a year-over-year uptick, but it was small enough to not be worrisome.
The week ended with the Dow UP 1.4%, to 34,838; the S&P 500 UP 2.5%, to 4,516; and the Nasdaq UP 3.2%, to 14,032.
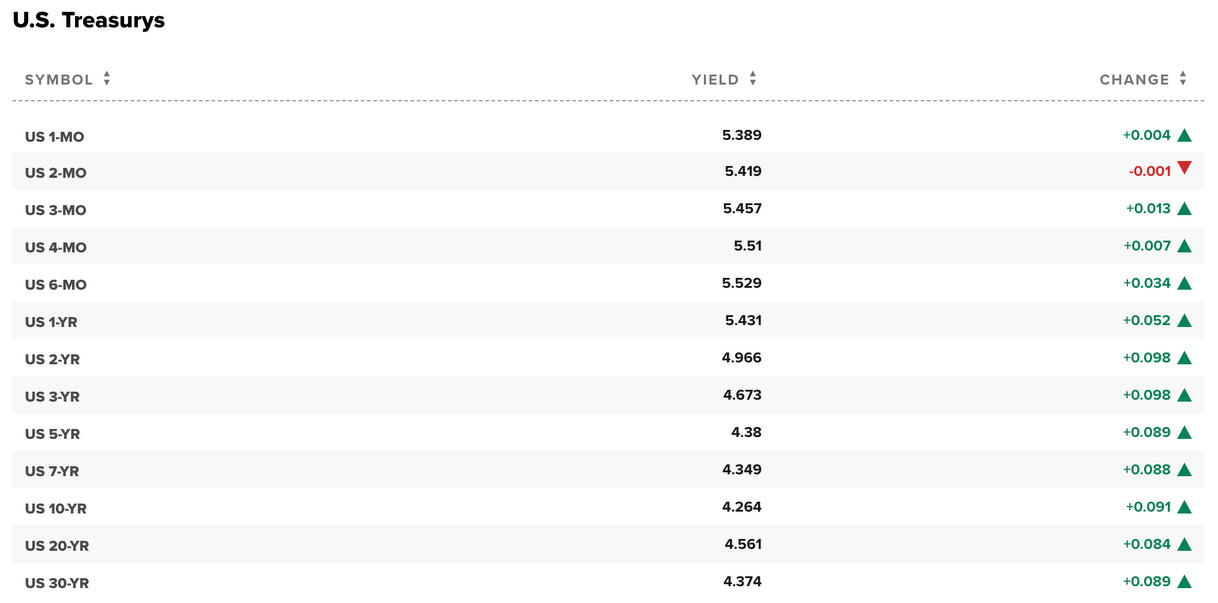
Overall, bonds finished ahead, the 30-Year UMBS 6.0% UP 0.94, to $100.09. The national average 30-year fixed mortgage rate reversed course, heading down in Freddie Mac's Primary Mortgage Market Survey. Remember, mortgage rates can be extremely volatile, so check with your mortgage professional for up-to-the-minute information.

Confounding all forecasts, Pending Home Sales rose in July at the fastest pace since January. The National Association of Realtors noted, “Jobs are being added and, thereby, enlarging the pool of prospective home buyers.”
Pending home sales improved in July, up 0.9% from June.
Month over month, contract signings increased in the South and West but decreased in the Northeast and Midwest.
Pending home sales fell in all four U.S. regions compared to one year ago.
The S&P CoreLogic Case-Shiller index reported a 0.7% increase in home prices in June, bringing them back to where they were a year ago. The FHFA index posted a 0.3% gain for the month, 3.0% ahead of last year.

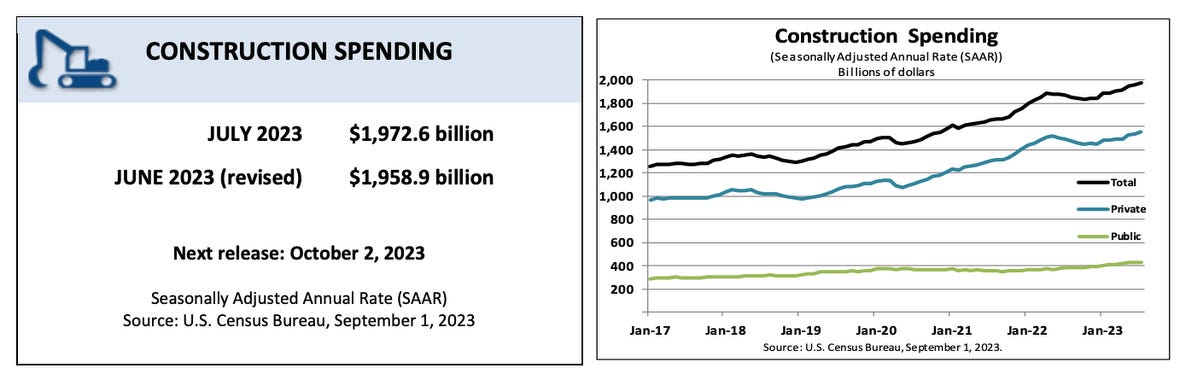
Residential Construction Spending continued to march forward in July, 1.4% over June. It’s still a bit behind where it was a year ago, but this July’s gain was powered by spending on much-needed single-family homes.
DID YOU KNOW… Based on data from the Census Bureau and HUD, the fall has seen higher home prices and less time on market for new homes than the rest of the year, and 2023 sales so far have outpaced 2022 levels.

As a Solar Ambassador for Solar Oasis, your referral will bank you $1,000 once a system is installed on their roof.
You can track the entire process on our platform. Click below for more information:

As of Tues. Sept. 5, 2023 11:05 AM PST

Each week we will update the current median price for the current month. Keep in mind the majority of sales occur at the end of the month, so official numbers will be published on the first Monday of each month. Median prices are calculated from 122 sold listings in from the MLS as of Sept. 5, 2023.
SEPTEMBER 2023 MEDIAN PRICES
Single Family
$447,250
unch
Unchanged from August of $447,750
Condo
$240,000
unch
Unchanged from August of $240,000
Townhomes
$292,000
-$47,618
Down from August of $339,618

As of September 5, 2023, there are currently active (M/m change):
4,053 Single Family Homes (+109) +2.76%
603 Condos (+12 ) +2.03%
429 Townhouses (+23) +5.66%
212 Manufactured Homes (+2) +0.95%
320 High Rise Units (+18) +5.96%
55 Multiple Dwellings (-9) -14.06%
2,336 Parcels of Land (+4) +0.17%
3,506 Rentals On Market (+137) +4.07%
Past Seven Days Market Watch (M/m change):
705 New Listings (-131) -15.67%
161 Back on Market (-51) -24.06%
128 Price Increases (-5) -3.76%
538 Price Decreases (-4) -0.74%
635 Accepted an Offer (-186) -22.65%
670 Sold (+29) +4.52%
240 Expired (+32) +15.19%
242 Taken Off Market (-120) -33.15%
This week, there are 255 more active residential resale properties on the market compared four weeks ago from Aug 7, 2023 for a total of 5,772 - an increase of 4.62%.

Las Vegas, NV 89120 | MLS 2523540
5855 Pearlite Ave.
5 BED | 3 BATHS | 3,307 SF
4.35 ACRES | POOL & SPA
IRREVOCABLE WATER/IRRIGATION RIGHTS (10 ACRE FEET)
EQUESTRIAN ARENA | BARN | FERTILE SOIL


SERVICES SECTOR, UNIT LABOR COSTS, FED BEIGE BOOK… The all-important services sector of the economy is expected down but still showing expansion, according to the ISM Non-Manufacturing Index. The Revised read on Unit Labor Costs for Q2 should still report a gain, which is not good, since higher labor costs are a leading indicator for higher inflation. We’ll also check out the Fed’s Beige Book for a look at the economy across the U.S.
All U.S. financial markets were closed yesterday, September 4, in observance of Labor Day.


Your equity grows as you pay down your home loan and as home prices increase. With home prices rising again, your equity is getting an extra boost.
Almost half of homeowners are equity rich because they have at least 50% equity in their homes. If you’ve been in your home for a while, you might have gained a considerable amount of equity, too.
Want to find out how much equity you have? Connect with a trusted real estate agent for a Professional Equity Assessment Report (PEAR)

Forecasting Federal Reserve policy changes in coming months. Wall Street now expects the Fed to keep the rate where it is in September, and leave it there for the rest of the year. Note: In the lower chart, a 7.0% probability of change is a 93.0% probability the rate will stay the same. Current rate is 5.25%-5.50%.
AFTER FOMC MEETING ON: CONSENSUS
Sep 20 5.25%-5.50%
Nov 1 5.25%-5.50%
Dec 13 5.25%-5.50%
Probability of change from current policy:
AFTER FOMC MEETING ON: CONSENSUS
Sep 20 7.0%
Nov 1 35.0%
Dec 13 36.2%